분석은 jupyter notebook에서 하고 개발은 vscode에서 한다.
# matplotlib이나 seaborn을 이용한 경우
    fig1 = plt.figure()
    plt.scatter(data= df, x="petal_length", y="petal_width")
    plt.title("Petal length vs width")
    plt.xlabel("tepal length")
    plt.ylabel("tepal width")
    st.pyplot(fig1)

    fig2 = plt.figure()
    sb.regplot(data=df, x="petal_length", y="petal_width")
    st.pyplot(fig2)

-> scatter는 산점도만, regplot은 산점도 + 회귀선이 나온다.
fig3 = plt.figure()
    plt.hist(data=df, x="petal_length" , rwidth=0.8, bins=20)
    st.pyplot(fig3)
-> 히스토그램
fig4 = plt.figure()
    plt.subplot(1, 2, 1)
    plt.hist(data=df, x="petal_length" , rwidth=0.8, bins=10)

    plt.subplot(1, 2, 2)
    plt.hist(data=df, x="petal_length" , rwidth=0.8, bins=20)
    st.pyplot(fig4)
-> 하나의 영역에 2개의 차트 그리기
# 판다스의 차트를 이용하는 방법
    fig5 = plt.figure()
    df["petal_length"].hist() # 눈금이 생김
    # plt.hist(data=df, x="petal_length")
    st.pyplot(fig5)

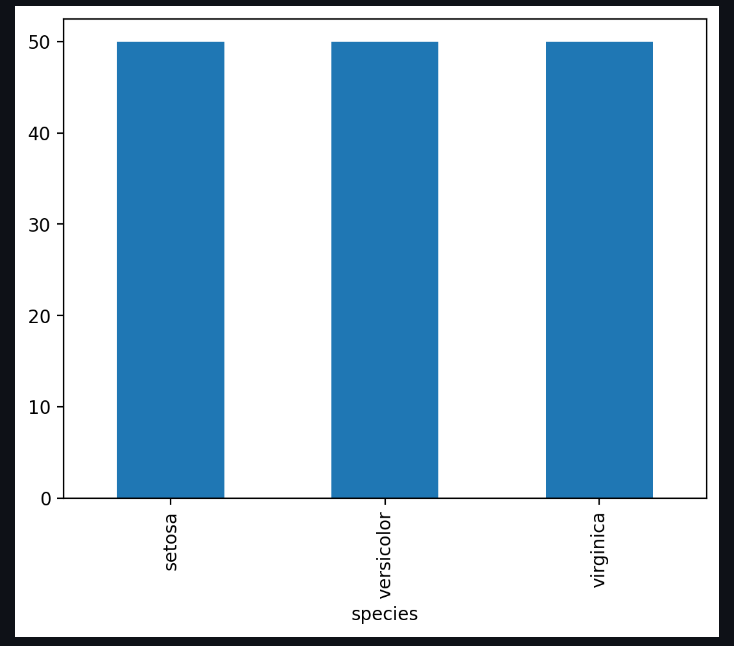
    fig6 = plt.figure()
    df["species"].value_counts().plot(kind="bar") # kind = barh 하면 y축
    st.pyplot(fig6)

-> 판다스의 차트를 이용하는 방법
plt, seaborn, 판다스의 차트는
차트 영역을 plt.figure()를 이용해서 변수 저장하고
st.pyplot을 이용해서 차트를 그리면 된다.

